Content starts here
CLOSE ×
Search
Skip navigation
The AARP Livability Index™ platform
Great neighborhoods for all ages

Communities

Communities are cities, counties, towns, neighborhoods, etc. where you live or might want to live. Search for any location in the United States, by address, town, city, county, state, or ZIP Code. For each community, you can see:

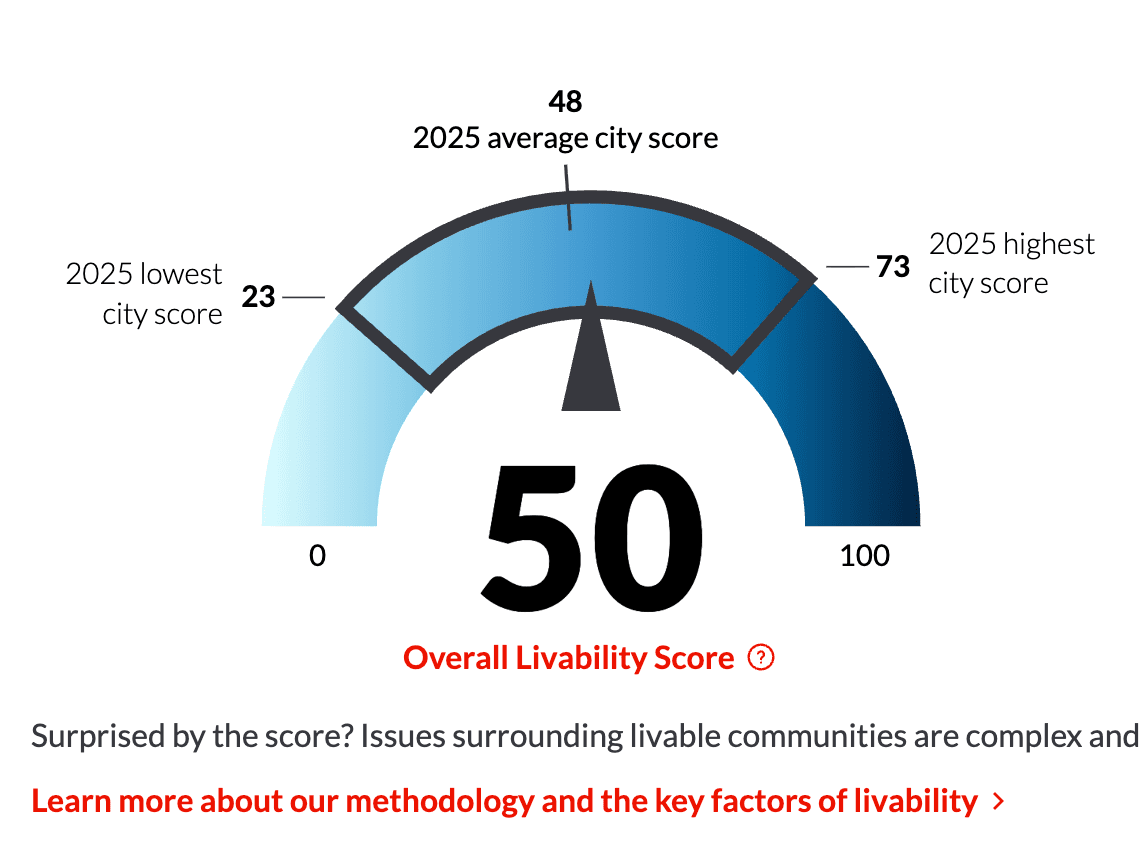
Gauge dial that shows Houston's livability score (50) on a dial, where 23 is the lowest city score, 48 is the average city score, and 73 is the highest city score for 2025.

A community’s overall livability score, scores for each of the seven livability categories, and values for the 61 total indicators within the categories.

AARP Livability Index™ Score Display

Infographic of the Community Score dial, with zero/"lowest possible" on the left, indicated by light blue, and 100/"highest possible" on the right, indicated by dark blue. There is an outline from approximately 20% to 75% indicating the range of actual community scores.

The AARP Livability Index™ platform draws from more than 50 different sources of data to give each neighborhood, city, county, or state an Overall Livability Score ranging from 0 to 100. This is reflected by the entire arc of light to dark blue. The large dial of the gauge points to the selected community’s score and the number below it is the value of that score.

We compute scores by comparing communities to one another, so the average community receives a score of 50. Those communities with more livability-friendly practices earn a score of 50 or above and those facing obstacles to livability score lower. 

In practice, the range of scores for communities at the selected community’s geographic level will be narrower than 0-100. This range is displayed with the back outline on part of the arc. This may show, for example, that a community with a score a little above 50 is closer to the highest-scoring community than it may at first appear.

Screenshot of the overview of Community Characteristics of Houston, Texas. Population demographics, Employment rate, and Climate Information is available in this section.

Community characteristics such as demographics, employment environment, and climate.

Screenshot of the map interface for Houston, Texas. The outline of Houston city limits is in black, and the different livability scores for the counties are shown in shades of blue.

An interactive map that both places a selected community within its regional context and allows exploration of smaller communities within it

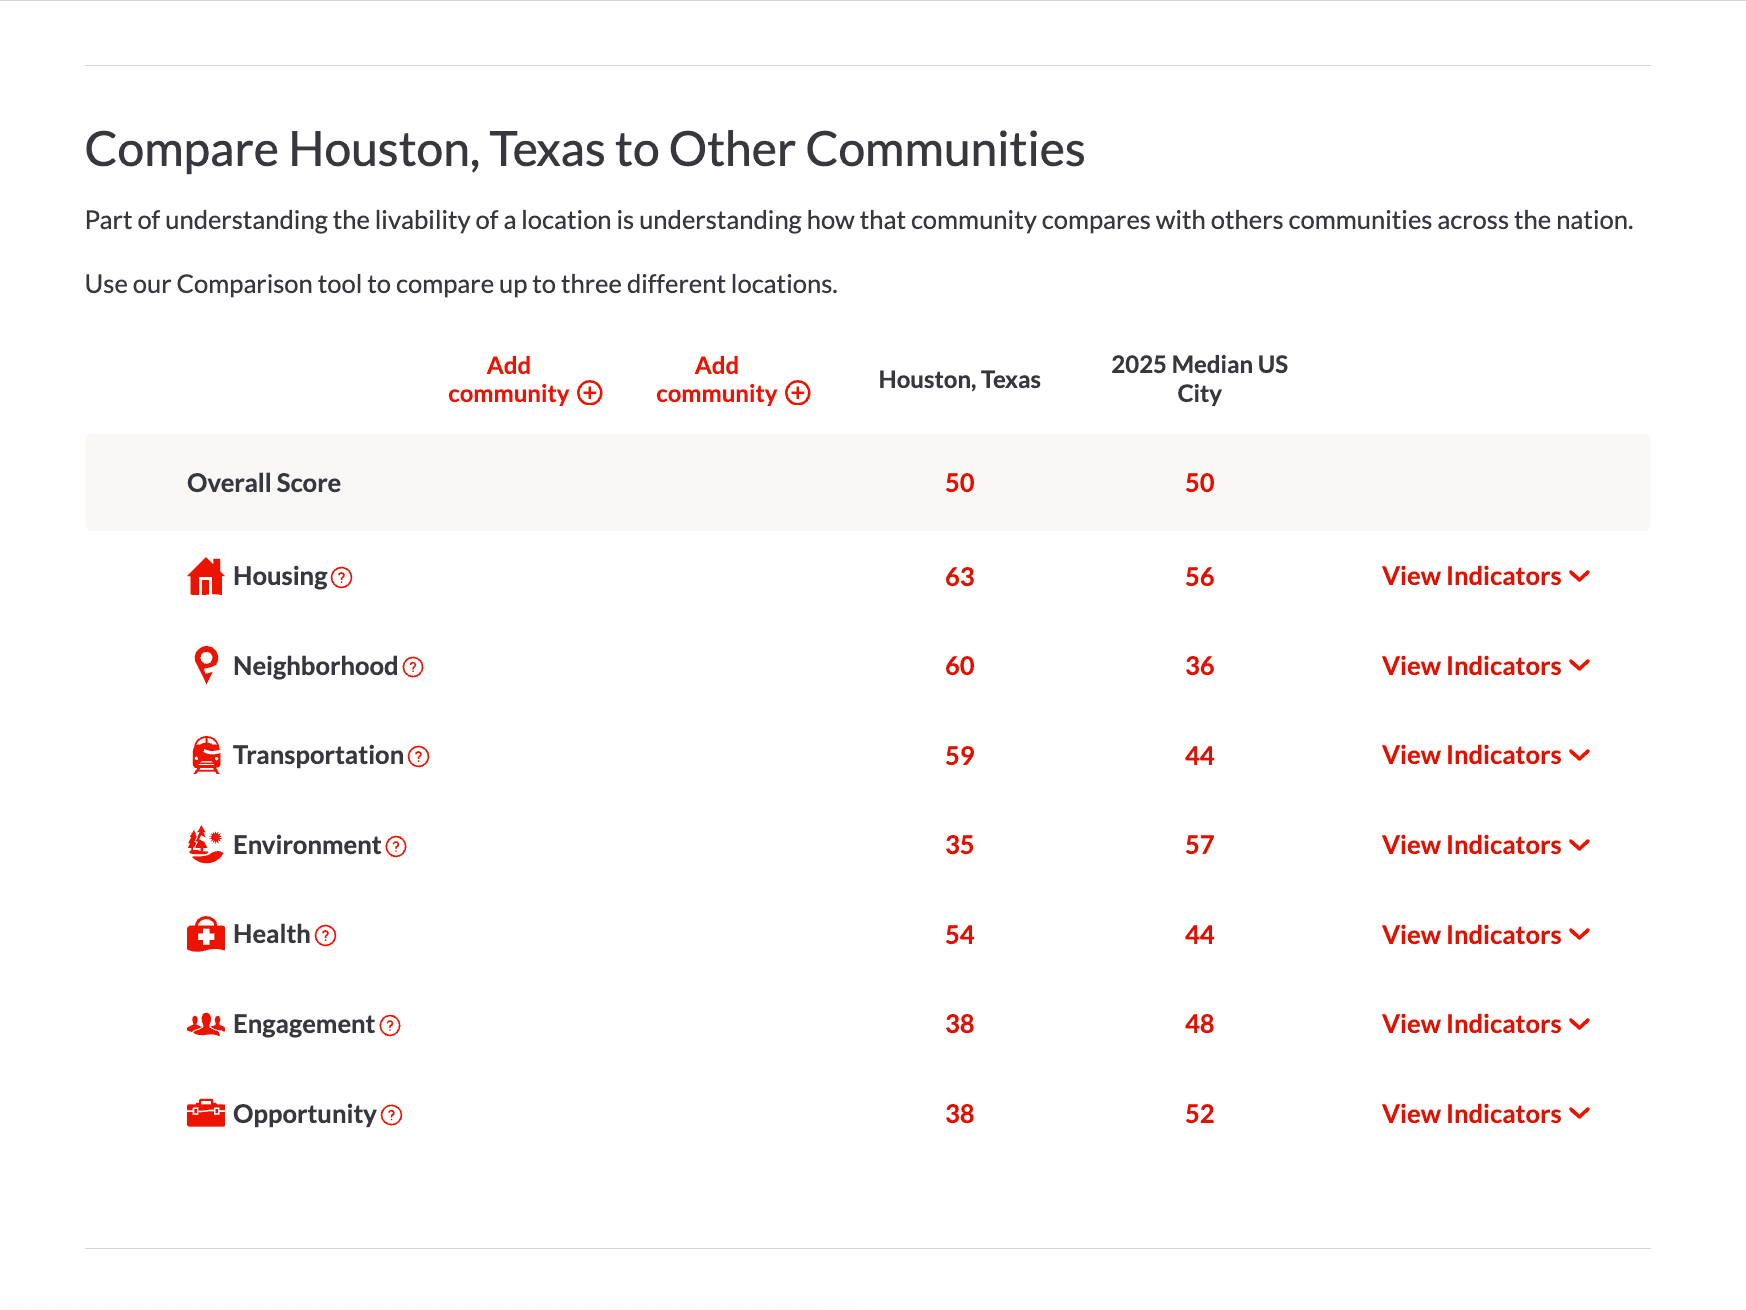
A screenshot of the "Compare Communities" tool, showing Houston, Texas compared to the 2025 Median City across all seven Livability indicator categories.

Compare how a community’s livability measures compare to those of up to two other selected communities

For each community you find and review, you can download a PDF to print the AARP Livability Index™ score, as well as the scores and related metrics and policies for each category.

Loading...

Still have questions about the AARP Livability Index™ Platform or want to provide feedback?

Contact our team