

AARP Hearing Center


Index Methods and Sources
How Are Livability Scores Determined?
AARP intentionally designed its scoring criteria to draw on multiple, interconnected points to capture the complexity of what produces a high quality of life for a diverse population across many ages.
Metric values and policy points are scored for each of the seven livability categories: housing, neighborhood, transportation, environment, health, engagement, and opportunity. A location’s total livability score is an average of those seven category scores.
How We Score Communities
AARP seeks a high quality of life for diverse populations across many ages. Producing such a quality of life, though, involves many complex factors. To create a reliable measure that captures this complexity, we intentionally designed its scoring criteria to draw on multiple, interconnected factors - categories and indicators - to present a complete picture of communities.
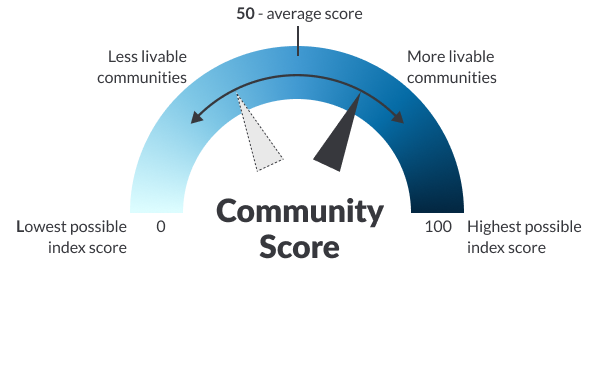
Understanding the Scores
Each neighborhood, city, county, or state is scored on a scale from 0 to 100. The average location scores a 50. Those communities with more livability-friendly practices earn a score above 50 and those facing obstacles to livability score lower.
Can a Community Be Perfect?
In theory, yes, but in reality, no. Scores are built from the neighborhood level up. A total livability score of 100 means that place is the best in the country in meeting all the metrics and policies for each of the seven livability categories and while ideal, no community scores 100 in all seven categories.
Components of the Scores: Categories
Metric values and policy points are scored for each of the seven livability categories: housing, neighborhood, transportation, environment, health, engagement, and opportunity. A location’s total livability score is an average of those seven category scores.
The categories each provide important pieces of the picture of livability in a community.
Livability Categories Explained

We spend more time in our homes than anywhere else, so housing costs, choices, and accessibility are critical. Great communities provide housing opportunities for people of all ages, incomes, and abilities, allowing everyone to live in a quality neighborhood regardless of their circumstances.
Livability Categories Explained
Housing
We spend more time in our homes than anywhere else, so housing costs, choices, and accessibility are critical. Great communities provide housing opportunities for people of all ages, incomes, and abilities, allowing everyone to live in a quality neighborhood regardless of their circumstances.
Neighborhood

Access and convenience make it easier for residents to navigate daily life. Proximity to parks, jobs, grocery stores, public transit, and libraries all play a role in creating a vibrant, enjoyable community. Diverse, walkable neighborhoods with shops, restaurants, and parks make local life interesting and keep residents connected.
Jump to the definition and sources for Neighborhood indicators
Transportation

Moving easily and safely from one place to another vastly improves quality of life. Transportation options that connect people to social activities, jobs, and medical care, and offer convenient, healthy, accessible, and low-cost alternatives to driving are paramount to supporting all community members.
Jump to the definition and sources for Transportation indicators
Environment

By measuring air and water quality, we assess how clean a community’s environment is today. We also track how prepared communities are to weather emergencies and natural disasters, and whether they benefit from state laws that promote energy efficiency and protect residents from utility disruptions.
Jump to the definition and sources for Environment indicators
Health

Healthy communities support access to high-quality care and foster healthy behaviors. Here we focus on preventing poor outcomes by supporting physical health, access to medical care and patient satisfaction. But health isn’t just quantified in this category. It appears throughout the other index categories. For example, access to healthy foods, jobs and education, number of walk trips, lower speed limits, social engagement measures, and air and water pollution are all related to health. Where you live matters.
Engagement

Human interaction should be supported and encouraged by our communities. From fostering social interaction and encouraging civic action to ensuring Internet access, residents need to be connected and be able to be part of their community.
Jump to the definition and sources for Engagement indicators
Opportunity

Inclusive communities can provide residents an equal chance to earn a living wage and improve their well-being, from jobs to education. Supporting multigenerational, diverse communities with a strong regional economy and fiscally healthy local governments is at the heart of ensuring a rich and full life for all.
Jump to the definition and sources for Opportunity indicators
Components of the Scores: Indicators
Within the seven categories is the heart of the AARP Livability Index™: the 61 indicators, made up of 40 metrics and 21 policies.
Metrics measure how livable communities are in the present. Data is collected and analyzed from local, state, federal, and private sources
Policies measure how communities might become more livable over time based on actions taken now. Policy data is derived from publicly available data and information and covers the entire United States.
We draw from more than 50 unique sources of data to populate these indicators. Twenty-three of the metrics evaluate livability at the neighborhood scale (defined as the census block, block group, tract, or high school district), while the others use data sources at higher levels of geography (metro area, city, or county).
Sometimes we use a data source as-is to create a metric. In other cases, existing data require extra calculations or statistical modeling to produce the best measure of community livability. In some cases, the AARP Livability Index™ combines multiple sources or creates estimates when data aren’t available. This allows us to produce the best set of metrics to measure livability and to create a nationwide neighborhood AARP Livability Index™.
Detailed Indicator Definitions and Sources
There was an error loading metrics:
There was an error loading metrics:
Additional Sources
Map Layer Data Not Included in Scoring
Key Terms
Understand important concepts and terms around the AARP Livability Index™.
Individual Preferences Reflected in the AARP Livability Index™
Personal preferences vary and change over time. AARP employs a variety of survey research to inform the selection of metrics and policies used in scoring. The intention is to reflect a wide range of preferences for people living at all stages of life.
Discover Survey Findings:
Expert Analysis
We conducted a thorough vetting process to determine which metrics and policies best capture the broad nature of livability. We also gave great thought and consideration to the data sources and methodology used in scoring. We did this in partnership with experts from the AARP Public Policy Institute (PPI), our consultant team, and PPI’s technical advisory committee, which includes 30 experts in public policy, community planning, public health, aging, environmental studies, consumer affairs, and economics. The result is a tool that sheds deep insight into what makes a community livable.